Origins of Coal
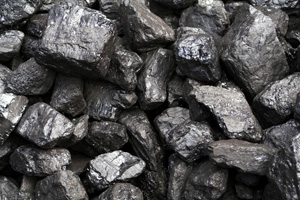
Coal is a readily combustible black or brownish-black sedimentary rock primarily composed of carbon and hydrogen and sometimes small quantities of sulfur. It is a fossil fuel formed by plant remains buried under layers of mud or water. The layers prevented biodegrading, thereby preserving the carbon that the plants had derived from the atmosphere through photosynthesis. It is carbon that gives coal most of its energy-producing capability.
The most abundant deposits of coal come from what were once forests in warm, swampy areas, between 300 and 400 million years ago. Plant matter eventually changed into a substance called peat. Over millions of years, increasing pressure and heat gradually transformed the peat into coal. Scientists estimate that from 3 to 7 feet of compacted plant matter is required to form 1 foot of bituminous coal.
Types of coal
As geological processes apply pressure to dead biotic matter, over time and under suitable conditions, it is transformed successively into peat, lignite, sub-bituminous coal, bituminous coal, anthracite, and finally graphite.
- Peat, considered to be a precursor of coal, has industrial importance as a fuel in some countries, such as Ireland and Finland.
- Lignite, also referred to as brown coal, is the lowest rank of coal and used almost exclusively as fuel for electric power generation. Jet is a compact form of lignite that is sometimes polished and has been used as an ornamental stone since ancient times.
- Sub-bituminous coal, whose properties range from those of lignite to those of bituminous coal, is used primarily as fuel for steam-electric power generation. Additionally, it is an important source of hydrocarbons for the chemical synthesis industry.
- Bituminous coal, a dense mineral, is usually black but sometimes dark brown, often with well-defined bands of bright and dull material. It is used primarily as fuel in steam-electric power generation, with substantial quantities also used for heat and power applications in manufacturing and to make coke for steel making.
- Anthracite is a harder, glossy, black coal used primarily for residential and commercial space heating.
- Graphite is technically the highest rank of coal, but it is difficult to ignite and so is not commonly used as a fuel. It is mostly used in pencils and, when powdered, as a lubricant.
Early Use
Evidence of coal use by early civilizations occurred between 200BC and 200AD. During this time period China, the Roman Empire and parts of Western Europe used and traded coal. However, there is no evidence that the product was of great importance before 1000 AD. Underground coal mining did not begin until the 13th century. The development of the Industrial Revolution led to the large-scale use of coal to fuel steam engines.
 Coal as Fuel in Modern Times
Food and electricity are the two largest commodities purchased by consumers in North America each year. Demand for electricity has continued to increase since the 1970’s. Although society has become more efficient in its energy use, demand for electricity has grown due to the introduction of new technologies, such as the internet and the electrical requirements to power millions of computers. Coal-fueled power plants generate approximately 2.0 kW·h of electricity per kilogram of burned coal. It takes just under 0.5 tons of coal to power a computer for a full year.
Coal has been the fastest-growing fuel source for each of the past five years. It generates more electricity worldwide than any other source, and it is responsible for about 40% of the world’s electricity. World coal consumption is about 6.2 billion tons annually. Coal generates about 50% of the electricity used in North America.
 Primarily used as a solid fuel to produce electricity and heat through combustion, the most common method of converting coal is to pulverize it and then burn it in a furnace with a boiler. The furnace heat converts the boiler water to steam, which is then used to spin turbines which turn generators and create electricity. The thermodynamic efficiency of this process has been improved over time.
Refined Coal
Refined coal is the product of a coal upgrading technology that removes moisture, ash and certain pollutants from lower-rank coals such as sub-bituminous and lignite coals. It is one form of several pre-combustion processes that alter coal's characteristics before it is burned.
Additional Uses for Coal
Coking
Coke is derived from low-ash, low-sulfur bituminous coal, baked in an oven without oxygen at high temperatures. Coke is used as a reducing agent in smelting iron ore in a blast furnace.
Gasification
High prices of oil and natural gas are leading to increased interest in "BTU Conversion" technologies such as gasification. In this process, coal is mixed with oxygen and steam while also being heated and pressurized. During the reaction, oxygen and water molecules oxidize the coal into carbon monoxide (CO) while also releasing hydrogen (H2) gas. Refiners collect synthesis gas at this stage.
Liquefaction: Coal-To-Liquids
Coal can also be converted into liquid fuels such as gasoline or diesel by several different processes. In the direct liquefaction processes, the coal is either hydrogenated or carbonized. In hydrogenation, coal is liquefied by mixing it with hydrogen gas and heating the combination. Carbonization (LTC), which is a low temperature process, can also convert coal into a liquid fuel.
The future of Coal
Clean Coal Technology
Although there is not a current economic solution to creating clean coal, many are searching for ways to achieve clean coal at a reasonable cost.
The goal is to remove carbon dioxide from the coal conversion process. The options listed represent the most logical path to the lowest cost of carbon reduction. The first option is to increase the efficiency of the carbon that is processed. The next option is to partially replace fossil fuels with biomass, which will reduce CO2. The last option is to capture the remaining CO2 for containment. The final option is not yet economically feasible and is the farthest from being cost effective. However, it is the process that has gained the most media attention.
 New coal fired power plants are being designed for higher efficiency in minimizing CO2 and other emissions. Lower cost technologies for CO2 capture are currently in the development stage.
World coal reserves
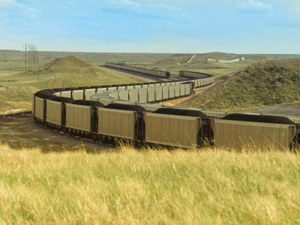
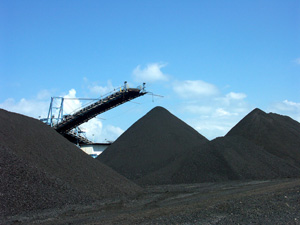
Coal is extracted from the ground by either underground mining or open pit mining. The total known deposits recoverable by current technologies is sufficient for 300 years' use at current consumption levels.
|
Proved recoverable coal reserves at the start of 2007 (million tonnes (teragrams)) |
|
Country |
Bituminous & anthracite |
SubBituminous & lignite |
TOTAL |
Share |
|
USA |
111,338 |
135,305 |
246,643 |
27.1 |
|
Russia |
49,088 |
107,922 |
157,010 |
17.3 |
|
China |
62,200 |
52,300 |
114,500 |
12.6 |
|
India |
90,085 |
2,360 |
92,445 |
10.2 |
|
Australia |
38,600 |
39,900 |
78,500 |
8.6 |
|
South Africa |
48,750 |
0 |
48,750 |
5.4 |
|
Ukraine |
16,274 |
17,879 |
34,153 |
3.8 |
|
Kazakhstan |
28,151 |
3,128 |
31,279 |
3.4 |
|
Poland |
14,000 |
0 |
14,000 |
1.5 |
|
Brazil |
0 |
10,113 |
10,113 |
1.1 |
|
Germany |
183 |
6,556 |
6,739 |
0.7 |
|
Colombia |
6,230 |
381 |
6,611 |
0.7 |
|
Canada |
3,471 |
3,107 |
6,578 |
0.7 |
|
Czech Republic |
2,094 |
3,458 |
5,552 |
0.6 |
|
Indonesia |
740 |
4,228 |
4,968 |
0.5 |
|
Turkey |
278 |
3,908 |
4,186 |
0.5 |
|
Greece |
0 |
3,900 |
3,900 |
0.4 |
|
Hungary |
198 |
3,159 |
3,357 |
0.4 |
|
Pakistan |
0 |
3,300 |
3,300 |
0.3 |
|
Bulgaria |
4 |
2,183 |
2,187 |
0.2 |
|
Thailand |
0 |
1,354 |
1,354 |
0.1 |
|
North Korea |
300 |
300 |
600 |
0.1 |
|
New Zealand |
33 |
538 |
571 |
0.1 |
|
Spain |
200 |
330 |
530 |
0.1 |
|
Zimbabwe |
502 |
0 |
502 |
0.1 |
|
Romania |
22 |
472 |
494 |
0.1 |
|
Venezuela |
479 |
0 |
479 |
0.1 |
|
TOTAL |
478,771 |
430,293 |
909,064 |
100.0 |
World Coal Consumption by Region, Reference Case, 1990-2020
(Million Short Tons)
The future markets for coal consumption are listed below. China is expected to increase by more than any other country doubling the US as well as its current consumption by 2025. Other countries with notable growth include India and Mexico.
|
Region/Country |
History |
Projections |
Average Annual Percent Change, 1999-2020 |
|
1990 |
1998 |
1999 |
2005 |
2010 |
2015 |
2020 |
|
Industrialized Countries |
|
|
|
|
|
|
|
|
|
North America |
959 |
1,121 |
1,122 |
1,263 |
1,349 |
1,401 |
1,480 |
1.3 |
|
United States |
895 |
1,040 |
1,045 |
1,176 |
1,251 |
1,294 |
1,365 |
1.3 |
|
Canada |
55 |
66 |
63 |
66 |
73 |
78 |
83 |
1.3 |
|
Mexico |
9 |
15 |
13 |
21 |
25 |
29 |
32 |
4.3 |
|
Western Europe |
894 |
566 |
546 |
498 |
485 |
469 |
436 |
-1.1 |
|
United Kingdom |
119 |
70 |
65 |
60 |
58 |
53 |
43 |
-1.9 |
|
France |
35 |
29 |
26 |
23 |
16 |
17 |
14 |
-3.1 |
|
Germany |
528 |
269 |
258 |
237 |
237 |
233 |
219 |
-0.8 |
|
Italy |
23 |
19 |
19 |
17 |
17 |
15 |
15 |
-1.2 |
|
Netherlands |
15 |
16 |
14 |
12 |
8 |
8 |
7 |
-3.3 |
|
Other Western Europe |
173 |
164 |
165 |
149 |
148 |
143 |
138 |
-0.8 |
|
Industrialized Asia |
231 |
287 |
295 |
311 |
323 |
332 |
337 |
0.6 |
|
Japan |
125 |
144 |
149 |
164 |
173 |
181 |
185 |
1.0 |
|
Australasia |
106 |
142 |
145 |
148 |
149 |
151 |
152 |
0.2 |
|
Total Industrialized |
2,084 |
1,974 |
1,963 |
2,072 |
2,157 |
2,201 |
2,252 |
0.7 |
| |
|
|
|
|
|
|
|
|
|
EE/FSU |
|
|
|
|
|
|
|
|
|
Former Soviet Union |
848 |
396 |
414 |
421 |
397 |
364 |
326 |
-1.1 |
|
Eastern Europe |
527 |
414 |
363 |
361 |
330 |
298 |
263 |
-1.5 |
|
Total EE/FSU |
1,375 |
810 |
778 |
782 |
727 |
662 |
589 |
-1.3 |
| |
|
|
|
|
|
|
|
|
|
Developing Countries |
|
|
|
|
|
|
|
|
|
Region/Country |
History |
Projections |
Average Annual Percent Change, 1999-2020 |
|
1990 |
1998 |
1999 |
2005 |
2010 |
2015 |
2020 |
| |
|
|
|
|
|
|
|
|
|
Developing Asia |
1,583 |
1,903 |
1,686 |
2,141 |
2,577 |
3,004 |
3,515 |
3.6 |
|
China |
1,124 |
1,300 |
1,075 |
1,421 |
1,797 |
2,170 |
2,592 |
4.3 |
|
India |
242 |
333 |
348 |
414 |
450 |
482 |
546 |
2.2 |
|
South Korea |
42 |
60 |
65 |
81 |
89 |
94 |
96 |
1.8 |
|
Other Asia |
175 |
210 |
197 |
226 |
241 |
258 |
282 |
1.7 |
|
Middle East |
66 |
99 |
96 |
101 |
119 |
125 |
127 |
1.3 |
|
Turkey |
60 |
86 |
84 |
88 |
98 |
102 |
104 |
1.0 |
|
Other Middle East |
6 |
12 |
12 |
12 |
21 |
23 |
23 |
3.1 |
|
Africa |
152 |
181 |
177 |
186 |
191 |
203 |
212 |
0.9 |
|
Central and South America |
26 |
42 |
41 |
43 |
47 |
52 |
58 |
1.7 |
|
Brazil |
17 |
28 |
27 |
30 |
35 |
40 |
47 |
2.6 |
|
Other Central/South America |
9 |
15 |
14 |
14 |
12 |
12 |
11 |
-0.9 |
|
Total Developing |
1,827 |
2,226 |
2,000 |
2,472 |
2,935 |
3,384 |
3,912 |
3.2 |
| |
|
|
|
|
|
|
|
|
|
Total World |
5,287 |
5,009 |
4,740 |
5,326 |
5,819 |
6,247 |
6,753 |
1.7 |
| |
|
|
|
|
|
|
|
|
|
Annex I |
|
|
|
|
|
|
|
|
|
Industrialized |
2,075 |
1,959 |
1,950 |
2,051 |
2,132 |
2,172 |
2,220 |
0.6 |
|
EE/FSU |
1,166 |
702 |
686 |
692 |
650 |
594 |
535 |
-1.2 |
|
Total Annex I |
3,242 |
2,660 |
2,635 |
2,743 |
2,781 |
2,766 |
2,755 |
0.2 |
|
Sources: History: Energy Information Administration (EIA), International Energy Annual 1999, DOE/EIA-0219(99) (Washington, DC, February 2001). Projections: EIA, Annual Energy Outlook 2002, DOE/EIA-0383(2002) (Washington, DC, December 2001), Table A16; and World Energy Projection System (2002). |
Disclaimer: The information in this section is believed to be from reliable sources but the company takes no responsibility for its content or accuracy.